行业动态
纳斯达克 100 指数与标准普尔 500 指数的表现情况
+ 查看更多
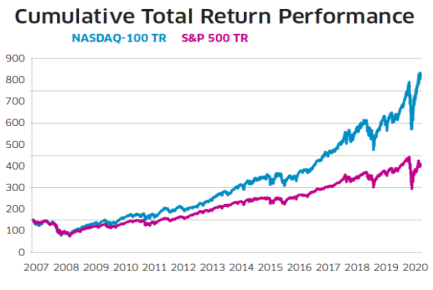
纳斯达克100指数和标准普尔500指数是美国最受欢迎的两个股票指数。纳斯达克100指数主要集中在技术、消费者服务和医疗保健等表现最好的行业,这些行业在2007年12月31日至2020年6月30日之间使得纳斯达克100指数较标准普尔500指数大幅上涨。在我们的研究中,纳斯达克100 TR指数的表现在过去12年中的有10年超过标准普尔500指数。


历史表现
下表和上方图表显示了纳斯达克100 TR和标准普尔500 TR在2007年12月31日至2020年6月30日之间的历史表现。尽管近期市场整体波动,纳斯达克100 TR指数仍保持渐增态势,总回报约为标准普尔500 TR指数的2.5倍。

滚动波动
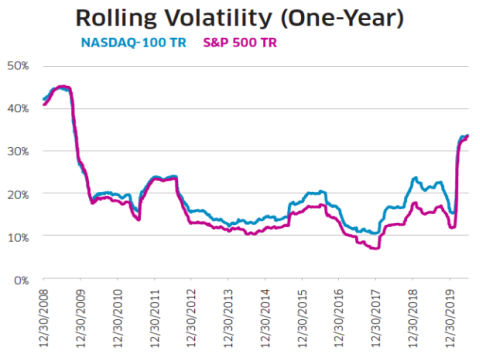
比较这两个指数,在2007年12月31日至2020年6月30日之间,一年滚动波动率(通过按日收益率的标准偏差计算,以年计算)为94%相关。鉴于纳斯达克100指数对技术的关注程度很高,纳斯达克100指数能够密切追踪标准普尔500指数的波幅,让人惊叹。

当前行业权重
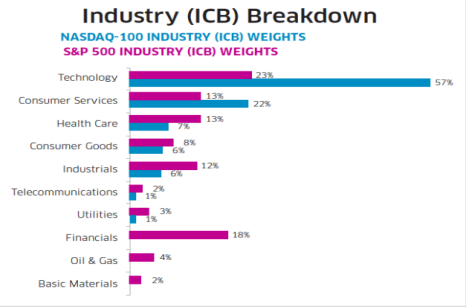
我们可以看到,截至2019年12月31日,纳斯达克100指数和标准普尔500指数之间存在重要差异。如前所述,对技术和消费者服务的最大配置推动纳斯达克100指数创下了历史新高。 2020年6月23日,据20年第一季度的观察,纳斯达克100指数超越了历史表现。纳斯达克100指数上半年收盘上涨16.9%,大大超过了标普500指数下跌3.1%的水平。
最新的业绩反映了18年第四季度之前的主要市场低迷以及之前的牛市阶段所发生的情况。在整个2018年,纳斯达克100指数表现优于标普500指数4.4%。在2017年和2019年,其表现分别超过11.2%和8.0%。到2020年,纳斯达克100指数已在过去12年中连续11次表现出色。

结论
纳斯达克100指数和标准普尔500指数是美国最受欢迎的两个股票指数。我们提供了这两个指数将近12年的表现情况和波动率分析。纳斯达克100指数主要配置在表现最佳的行业,例如技术、消费者服务和医疗保健。这些行业中公司的持续增长强劲。鉴于技术影响世界并提高公司效率,这种趋势很有可能会继续向前发展。
The Nasdaq-100 and S&P 500 are two of the most popular equity indexes in the US. The Nasdaq-100 is heavily allocated towards top performing industries such as Technology, Consumer Services, and Health Care, which have helped the Nasdaq-100 outperform the S&P 500 by a wide margin between Dec. 31, 2007 and June 30, 2020. Below is a comparison of annual total returns - which reinvest dividends - between each index. The Nasdaq-100 TR Index has outperformed 10 out of the 12 years in our study.
Historic Performance
The table below and the charts above display historical performance figures for both the Nasdaq-100 TR and the S&P 500 TR between Dec. 31, 2007 and June 30, 2020. Despite recent overall market volatility, the Nasdaq-100 TR Index has maintained cumulative total returns of approximately 2.5 times that of the S&P 500 TR Index.
Rolling Volatility
One-year rolling volatility (calculated by taking the standard deviation of daily returns, annualized) was 94% correlated between Dec. 31, 2007 and June 30, 2020, when comparing the two indexes. Given the large exposure the Nasdaq-100 has towards Technology, the ability for the Nasdaq-100 to closely track the volatility of the S&P 500 is rather impressive.
Current Industry Weights
We can see important differences between the Nasdaq-100 and the S&P 500 as of Dec. 31, 2019. As mentioned previously, the largest allocations to both Technology and Consumer Services helped propel the Nasdaq-100 Index to a new all-time high on June 23, 2020, extending the historic outperformance observed during 1Q’20. The Nasdaq-100 finished the first half of the year with a gain of 16.9%, significantly outpacing the S&P 500’s loss of 3.1%.
This most recent outperformance mirrors what occurred in the preceding major market downturn in 4Q’18, as well as during prior bull market phases. For 2018 as a whole, the Nasdaq-100 outperformed the S&P 500 by 4.4%. In 2017 and 2019, it outperformed by 11.2% and 8.0%, respectively. In 2020, the Nasdaq-100 is well on its way to outperforming for the 11th time in the last 12 calendar years.
Conclusion
The Nasdaq-100 and S&P 500 are two of the most popular equity indexes in the US. We provided performance and volatility analysis for almost 12 years. The Nasdaq-100 is heavily allocated towards top performing industries such as Technology, Consumer Services, and Health Care. The growth of companies in these industries has continued to be strong. Given the way technology is influencing the world and making companies more efficient, this trend is more than likely to continue going forward.
(Source: www.nasdaq.com)


